Ashok Leyland, a leading Indian automotive manufacturer, held a conference call on February 6, 2024, to discuss its financial performance for the first nine months of the current fiscal year (April-December 2023). The company reported strong results, with record-breaking revenue, EBITDA, and PAT.
KEY HIGHLIGHTS:
Revenue: Rs. 27,100 crores, highest ever
Sales Volume: 1,38,416 units, highest ever
EBITDA: Rs. 3,014 crores, highest ever
PAT: Rs. 1,718 crores, highest ever
EBITDA Margin: 12.0% in Q3, moving towards mid-teen target
INDUSTRY OUTLOOK:
Domestic MHCV industry growth: 9% in the first 9 months
Q4 industry growth may be subdued due to high base effect and union elections
Medium-term industry outlook remains favourable due to strong macroeconomic environment, healthy replacement demand, and improving freight demand
COMPANY STRATEGY:
Focus on profitable growth, not sacrificing margins for market share
Continuous cost reduction efforts
Strict pricing discipline
Expansion of sales network and service reach
Investment in electric vehicles through Switch Mobility
ELECTRIC VEHICLE BUSINESS(SWITCH MOBILITY):
Strong performance of Switch products in the market
First batch of electric LCVs to be delivered within the next few months
Commercial launch of electric truck and nearing market trials of electric tractor trailer
Investment of Rs. 662 crores in Optare PLC, the holding company for Switch UK and Switch India
FINANCIAL PERFORMANCE:
Q3 Revenue: Rs. 9,273 crores, up 3% YoY
Q3 EBITDA: Rs. 1,114 crores, up 40% YoY
Q3 PAT: Rs. 580 crores, up 61% YoY
Operating working capital: Rs. 2,004 crores
Net debt: Rs. 1,747 crores
ANALYST’S EXTRAPOLATION OF FUTURE PROFITS:
Based on the company’s strong performance and positive industry outlook, it is reasonable to expect continued growth in the next 2-3 years. The company’s focus on profitable growth, cost reduction, and expansion of its sales network and service reach should drive further revenue and margin improvements.
PROFIT FORECAST:
Based on the company’s strong performance in the first 9 months of the current financial year and the favourable industry outlook, it is reasonable to expect continued growth in the next 2-3 years. The company’s focus on profitable growth, cost reduction, and product differentiation should support margin expansion and revenue growth.
PROFITABILITY FORECAST:
Year 1: 13-15% EBITDA margin
Year 2: 15-17% EBITDA margin
Year 3: 17-19% EBITDA margin
MANAGEMENT GRADE:
The management team of Ashok Leyland has demonstrated strong leadership and execution capabilities. They have successfully navigated the challenges of the pandemic and positioned the company for long-term growth. The management’s focus on profitability, innovation, and customer satisfaction is commendable.
Based on the company’s strong financial performance, strategic initiatives, and focus on long-term growth, overall, I would grade the management team a score of 90 out of 100.
Gross revenue for 3Q FY2024 reached Rs. 1.2 billion, a historic feat for the company.
Digital payments business through CCAvenue led the revenue increase.
Standalone business constitutes 94% of consolidated gross revenue, with strong operating and profit margins.
Consolidated EBITDA margins at 61.2%, profit margins at 37.3%.
2. India Payments Business:
India payments business added almost a billion rupees in gross revenue in a single quarter.
CCAvenue added over 200,000 merchants, averaging 2,500 merchants daily.
India payments transaction processing volume rose to Rs. 663 billion, growing at 34% YoY.
Net revenue for India payments business grew 34% YoY, crossing Rs. 500 million for the first time.
3. International Business:
Focus on growing international payments business, particularly in UAE (Amrit Kaal).
Plans to scale international business further in the coming weeks to months.
4. GeM Contract Update:
Infibeam Avenues continues to use the GeM platform, with discussions on intellectual property and commercial terms ongoing.
Expects resolution within the quarter and will update stakeholders accordingly.
5. Artificial Intelligence Initiatives:
Significant strides in building artificial intelligence capabilities for both payments and the platform business.
Launched India’s first AI hub, Phronetic.AI, at GIFT City Gandhinagar.
Signed Rs. 20 billion MoU with the Gujarat government for developing the AI hub.
6. Financial Highlights by CFO Sunil Bhagat:
Gross revenue crossed US$100 million in the quarter, growing at 120% YoY.
India payments gross revenue grew at 147% YoY.
Net take rate stable at 8.5 basis points. Expecting it to increase going forward.
Nine-month consolidated financial performance showed substantial growth across TPV, gross revenue, net revenue, EBITDA, and PAT. The company is on its way to post its best annual performance in FY24.
7. Future Outlook and Strategies:
Focus on profitable growth rather than growth at any cost.
Strategies include continuous addition of merchants, TapPay solutions, and international expansion.
Strong performance in UAE, aiming to grow from 7,000 to 70,000 merchants in the next 12-24 months.
Aspires to achieve double-digit net take rate in the India business.
8. Other Highlights:
Investments in Pirimid Fintech for capital market software and lending frameworks.
Exploring opportunities in real-time settlements, AI, and lending frameworks.
Strong emphasis on the potential of AI to enhance productivity, security, and customer experience.
The company expresses confidence in sustained profitable growth and hints at further announcements in the coming weeks regarding their AI initiatives and expansion plans.
INVERSE U.S BOND YIELD CURVE AND WAR IN THE MIDDLE EAST – LONG TERM EFFECTS ON INDIAN MARKETS
An unusual and rare phenomenon is happening in the U.S Bond Markets. How will it affect India?
The United States is going through a major crisis.
Decades of zero-interest rates and the double whammy of the unprecedented spending spree during the COVID years have sent the birds back to roost at the Federal Reserve’s nest. As the central bank of the United States, the Federal Reserve’s (Fed) mission is to promote the effective operation of the U.S. economy. It uses monetary policy—actions to achieve maximum employment and stable prices (also known as its “dual mandate”)—to support economic growth.
Effective monetary policy complements fiscal policy—the use of government spending and tax policies to affect economic conditions. The Fed also promotes the stability of the financial system; stable financial markets are necessary for a well-functioning economy. This is very similar to the mandate of the Reserve Bank of India.
To know more about U.S Markets and build a portfolio of U.S stocks, follow The Money Memo on Instagram and WhatsApp
But the COVID years were unprecedented for central banks around the world. They had to take a decision to save their economies from collapsing and also support jobs at the same time (Unemployment in the US surged from 3.5% to 14.7% within three months). And since there was no precedent to fall back upon, some of them resorted to measures that have not been seen in the past – The Fed took it to the next level.
It injected liquidity – another term for printing money – into the markets by directly intervening and buying securities (stocks, bonds and other assets) to support prices and also by bringing the interest rates to zero. It is estimated that the Fed printed almost $3.3trillion in 2020 alone (almost one-fifth of all dollars in circulation) in an economic concept called “Quantitative Easing” or QE.
This concept is applied in emergency situations when the central bank has to print money to keep the economy buoyant. However, this is a stop-gap measure and not a long-term solution.
This excess liquidity found its way to other markets too – Indian stock markets were making merry in the period immediately after the pandemic set in, with the Nifty going from 7500 to 1800 within two years. Something that was unheard of, even in a growing market like India.
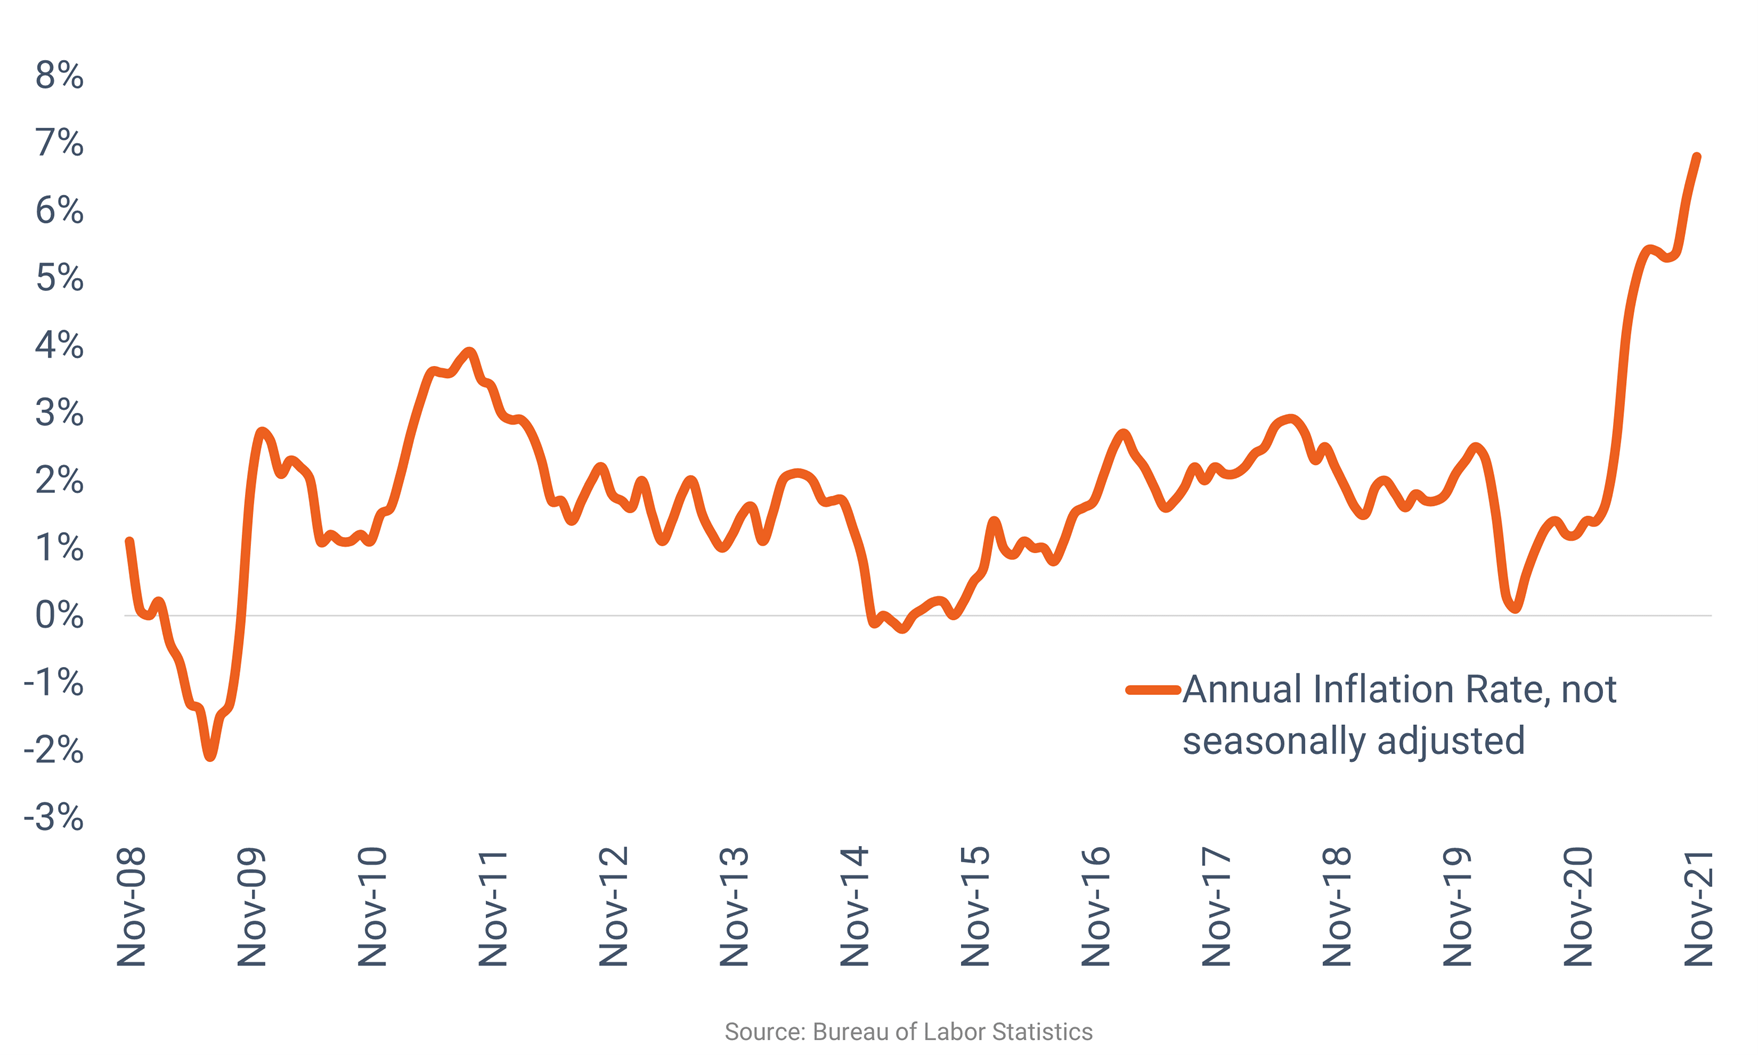
Back in the US, all this printing would come at a terrible price – high inflation. Inflation in the US jumped to levels unseen in four decades – almost to 9%. Even in India, inflation stayed below 9% during the COVID years and after. So, you can imagine why this was a big deal.
Inflation rate in the United States
And hence, once the Fed had arrested the economic crash, they now had to reverse the ill-effects of quantitative easing. In economics parlance, the opposite of QE is “Quantitative Tightening” or QT. This is when the central bank starts shrinking the money supply by increasing the interest rates and capital requirement for banks. This is textbook economics.
But there is a problem.
All these years of zero-interest rates post the 2008-crisis meant cheap money sloshing around in the system and making Americans habitual to it. People were taking up loans to fuel consumption and mortgages to buy expensive homes that they otherwise could not afford. Investors were buying up stocks on the market with access to cheap money, starting a raging bull run on the indices.
And now, with inflation pinching their savings, rates getting higher and oil prices heading up due to the Ukraine war, the going was getting tough for the common American citizen.
So, when the interest rates went from zero to 5.25% real quick, the economy found itself in a shock. In addition, when the interest rates rise, investors start moving their money from equity to bonds – especially US treasury bonds, which are considered a safe haven – and since the tightening happened quick, the money moved away quick as well.
This has been evident in the recent sell-off in the U.S markets – S&P 500 is down a staggering 22.57% in the past week and expected to fall more. This can trigger a sell-off in Indian markets too, albeit at a slower pace because India is being increasingly seen as an economic powerhouse that can hold its own by global investors.
All this flurry of activity has also given rise to a peculiar problem.
An inverted bond yield curve.
The Bond Yield Curve
You see, bonds are considered a safe and predictable asset class. In a mature economy – like the U.S – it is quite possible to forecast the performance of a bond from the short term (6 months) to the very long term (30 years). This forecast consists of mainly the bond yield plotted against the time to maturity of the bond. This is called a Bond Yield Curve, and usually looks like this:
Normal Bond Yield Curve
This shows that the yield increases with maturity – a logical explanation, as the investors who hold a bond for longer would have the higher uncertainty (or risk) about its performance and thus will have to be given a higher incentive (interest rate) for them to invest in the long-term bonds.
To learn more about Bonds and how to invest in them, check out my top-rated course on Udemy with more than 420 students here.
For example, let us take a 2-year bond that is priced at $100. Since it’s a short-term bond, you as an investor will consider it low risk, because you kind of can estimate that the central banks would not meddle with the interest rates, so you can still get at least $100 back at the time of maturity and also the interest payments. Since the risk is low, the debtor (govt or a company that issues that bonds) will offer a lower coupon (or interest) on the 2-year bond, as there are enough takers for it.
However, if we take a 20-year bond that is priced at $100, the debtor will have to offer a higher interest payment on it for someone to buy it, because nobody knows what will happen in 20 years – I mean, there could be a war and the country itself could cease to exist! Hence, the interest payments offered on these long-term bonds are much higher. This way, the debtor has peace of mind that he does not have to pay you back for 20 years, and you feel happy getting a higher interest.
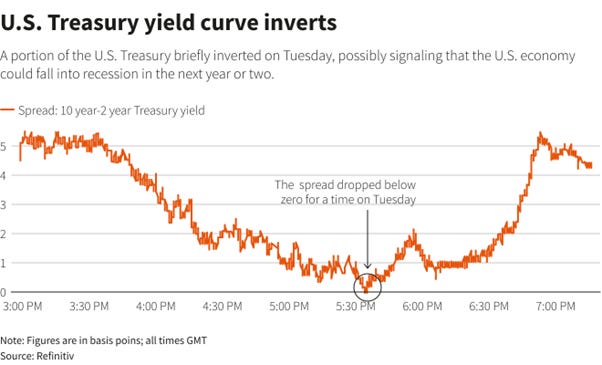
Interestingly, this centuries-old convention has been broken in 2023 in the U.S bond market.
Take a look at the bond yield curve as of now:
Current U.S Bond Market Yield Curve – Inverted
Now your question must be: What does this mean?
Every time this rare event has happened in history, there has been a recession following the event.
It happened in 1987, 1999 and 2008 which were the years that the U.S saw a recession, and now it has happened again in 2023. This data tells us of an impending recession in the U.S economy that many analysts have been predicting for the past six months or so. Indeed, the birds have come back to roost.
And since the short-term bond yields are now higher, we can expect investors pulling out money from the stock market and depositing it in the bond market to protect their capital and also to take advantage of the higher interest payments.
This can also affect FII investment in India, where the current bull market rally has been fueled in a large part by capital flow from foreign shores. Let us see how it may affect our markets this time around.
Effect on India and Its Markets
To understand how a recession in the US affects India and its markets, we need to understand the amount of money that is brought into our markets by foreign institutional investors (FII). Since a recession in the US is accompanied by higher bond yields as we saw above, it is better for these FIIs to pull out their money and invest it in bonds which are safer. Similarly, when the economy does better, the stocks get more attractive, bond yields fall, and the capital takes the other route.
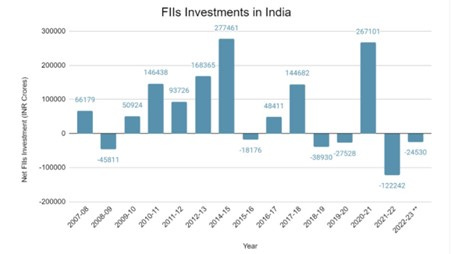
FIIs have been a strong force in the Indian markets for decades as seen in the chart below:
FII Investment in India
As you can see, in the recession year of 2008-09, the FIIs withdrew more than INR 45,811 crores from the Indian markets. In 2020-21, when the rates were almost zero in the U.S, and the bond yields correspondingly low, the FIIs pumped money into the Indian markets.
But 2021-22 is where it gets interesting.
This is the FY when Fed first started increasing rates. And there was talk about them rising even faster than anticipated earlier. This triggered a short correction in the stock markets in the U.S, and also in India. Since this Fed rate hike was the first in three years, most investors expected the QT to continue and pulled out their capital from emerging markets like India and moved to the U.S treasuries, taking advantage of the higher yields again.
To learn more about investing in Indian and U.S equities you can also follow me on Instagram.
In 2022-23, the situation became more certain. Fed was going to keep the rate hike cycle going well into FY24 (which turned out to be the case) and was not reneging on bond yields or shrinking money supply. This can be seen in the FII outflow being arrested on the above chart. I hope that it all makes sense now.
War in the Middle East and Festival Season
Now for the rest of the 2023, what should Indian investors expect? The fall in stock prices in the U.S will definitely have ripples on Indian markets too. However, the pullback may not be as drastic as 2021, and this time it may be more muted. To add to that, the festival season is fast approaching, not only in India but also in the U.S – Thanksgiving and Christmas.
This means consumption is going to soar and companies are going to have a strong quarter. This quarter earnings will be announced in India only in early 2024 and is likely to have a positive outcome on stock prices.
The war in the middle east is going to result in higher commodity prices, including oil, which may put correction pressures on Indian stocks in the short term. But as we have seen in the case of the Ukraine war, investors are not exactly fazed by a localized war – unless the current conflict turns into something bigger. After a brief fall at the start of the Ukraine war, Indian equities have been on a bull rally that is still intact at the time of writing.
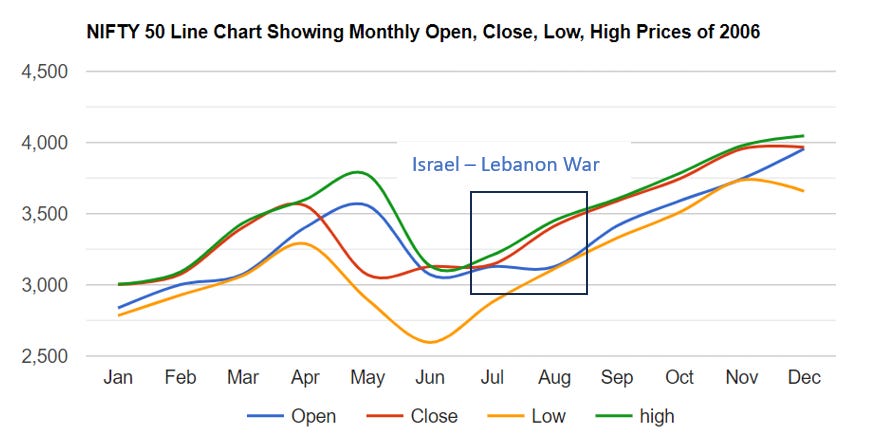
The data shows that even during the war years of Kargil or the most recent major conflict in the middle east – the 2006 Lebanon war – Indian equity markets took it in their stride and continued to inch up. But keep in mind that the liquidity in the Indian markets back then was a fraction of what it is now, and the volumes are much higher as well. Investors should take momentary fall in prices as opportunities to stock up on their long-term investments.
Nifty Performance during the Kargil War
And here’s a look at how the Indian markets performed during the 2006 Lebanon War, which was the last major conflict in the Middle East.
Nifty Performance during the 2006 Lebanon War
However, as per the bond yield data, the recessionary conditions will be put in motion by mid-2024 and this is when we can see a correction in Indian markets as well. Not to mention the Indian stock markets would be at their all-time highs at about this stage, thereby enabling some profit-booking from DIIs as well.
Conclusion
The major development that we have seen from the bond market crash in the U.S, and the subsequent performance of equities in India and the U.S itself, has been the significant decoupling of both the markets from the yesteryears. The magnitude of correlation has significantly narrowed in the recent past, indicating organic strength of India’s own private and public investors based on the strong performances of Indian companies.
However, the retail investor still has to assess market conditions in context with their long-term goals and be unfazed by geopolitical situations – instead take these as opportunities to accumulate more of their favorite stocks, albeit in reasonable quantities.
The future shines bright for India, and this is a shared destiny for many new investors who are beginning to understand the power of equities.
INDIA’S INCREDIBLE ECONOMIC GROWTH: AN 8-POINT ROLLERCOASTER RIDE TO PROSPERITY!
Introduction
Today, let’s get on a quick rollercoaster ride to a thrilling journey through the vibrant landscape of India’s economic growth. Strap in, because we’re about to take you on a rollercoaster ride that will make your heart race and your optimism soar! India’s journey from an agrarian economy to an emerging global powerhouse is nothing short of spectacular, filled with twists, turns, and breathtaking moments. We will make eight stops where we will quickly look at what happened at each of those inflection points. Let’s go!
Stop 1: The Humble Beginnings
Our rollercoaster adventure begins in the mid-20th century when India gained independence from British colonial rule. At the time, the Indian economy was predominantly agrarian, with a largely unskilled and impoverished population. But as the nation took its first tentative steps towards economic development, a vision emerged—a vision of progress, prosperity, and self-reliance.
Stop 2: The Infamous Pitfalls
As our rollercoaster ascends, we can’t help but acknowledge the pitfalls along the way. India faced a fair share of challenges, from political instability to bureaucratic red tape. The License Raj, a system of extensive government control and regulations, stifled innovation and entrepreneurship. But every plummet into a valley was followed by a climb towards the sky.
Stop 3: The Reforms Take Flight
Hold on tight because here comes the exhilarating part! In 1991, India took a leap of faith with economic liberalization, opening its doors to foreign investment and dismantling the shackles of protectionism. The result? An economic take off that defied gravity! With reforms like the New Economic Policy, India’s GDP growth soared, and the country began to attract foreign investment like never before.
Stop 4: The IT Revolution
As we loop around the IT boom, it’s impossible to ignore the impact of the Indian technology sector. India became the world’s outsourcing hub, with Bangalore and Hyderabad emerging as global tech centres. The Information Technology and Business Process Outsourcing (IT-BPO) industry propelled the nation into the digital age, creating millions of jobs and fostering innovation.
Stop 5: The Demographic Dividend
As we zoom through the demographic dividend curve, we see that India’s young and burgeoning population is a vital asset. With a median age of 28, India is set to have the world’s largest workforce, potentially driving further economic growth as this demographic enters its prime working years.
Stop 6: Infrastructure and Connectivity
Our rollercoaster ride wouldn’t be complete without mentioning India’s massive infrastructure development. From world-class airports to modern highways and the ambitious Smart Cities Mission, India is laying the foundation for a robust economy that can compete on the global stage.
Stop 7: Challenges Ahead
As we head into the final stretch, it’s important to acknowledge that our rollercoaster ride isn’t without its share of challenges. Income inequality, environmental concerns, and social disparities are issues that need careful navigation. But India’s history has shown that it has the resilience and determination to tackle these obstacles head-on.
Stop 8: The Future Awaits
As we approach the end of our thrilling journey, we can’t help but feel optimistic about India’s economic future. With a dynamic and youthful population, a growing middle class, and a commitment to innovation, India is poised to continue its ascent towards prosperity.
Conclusion
India’s economic growth story is nothing short of awe-inspiring. From humble beginnings to global recognition, the nation’s journey has been filled with highs and lows. As we disembark from our economic rollercoaster, we’re left with a sense of excitement for what lies ahead. India’s incredible economic growth is a testament to the spirit of its people and their unwavering determination to create a better future.
So, here’s to India’s rollercoaster ride to prosperity – a thrilling adventure that shows no signs of slowing down!
A Zero-debt, Diversified Small Cap that Owns 70 acres of Prime Land in Mumbai!
What if I told you one of the best real estate small cap companies in India was debt-free and also holds 1600 crores in cash reserves?
Introduction
If you have been to Mumbai, then you would know that the two affluent suburbs of the city are Goregaon and Malad. And the latter is landmarked by Mindspace, that huge IT complex which makes everything look smaller in the vicinity. Similarly, there is another IT Park that stands tall in Goregaon. If you have ever driven on the Western Expressway, you cannot miss this one – the NESCO IT Park.
And today we will take a look into the company behind it.
NESCO Limited, also known as the New Standard Engineering Company Limited, is an Indian company with a rich history and a diverse range of business interests. Founded in 1939, NESCO has evolved over the decades and established itself as a prominent player in various sectors of the Indian economy.
Let us first look at a brief overview of NESCO Limited:
NESCO Limited was originally established as the New Standard Engineering Company in Mumbai, India, in 1939. The company started as an engineering and construction firm, primarily focused on industrial projects. Over the years, NESCO has diversified its business interests. Today, it operates in multiple sectors, including:
Real Estate: NESCO is well-known for its extensive real estate holdings, particularly in Mumbai. The company owns and manages commercial and industrial properties, including the iconic Bombay Exhibition Centre (BEC), one of India’s largest exhibition and convention centres. Also, if you have ever been to Goregaon, you cannot miss the NESCO IT Park, one of the largest in the city. NESCO has a land bank of 70 acres in Goregaon (I know right!) of which almost 80% has been utilised for the IT Park and the rest used for green spaces.
The NESCO IT Park in Goregaon, Mumbai.
Infrastructure: NESCO is actively involved in infrastructure development, through its wholly owned subsidiary Indabrator, the construction of roads, bridges, and other civil engineering projects. They are a significant player in Maharashtra and Gujarat and has a good hold in Mumbai for EPC projects.
Information Technology: NESCO has a presence in the IT sector through its subsidiary, NESCO Tech Limited, which provides a range of IT solutions and services. This is in addition to their IT Parks.
Bombay Exhibition Centre (BEC): One of NESCO’s most significant assets is the Bombay Exhibition Centre, India’s largest exhibition centre, which has become a hub for trade shows, exhibitions, and conferences in India. It hosts a wide variety of national and international events, contributing to India’s economic and business growth. The charges to showcase at BEC are one of the highest in the country, and with the elevation of Mumbai to newer heights with economic expansion in this decade, these charges are slated to go higher.
The Bombay Exhibition Centre (BEC) is the largest in India.
Food: Now this is something I am particularly interested in. Everyone knows that, with the huge population in our country and especially the cities, the food segment is a goldmine. NESCO has its own food brands that they promote through their cafeterias and canteens in the IT Park and elsewhere that spans from snacks to fine dining. I personally think there is a whole lot of scope of expansion in this particular segment. Currently the revenues from this segment are 11.65 crores and has the potential to go north of 50 crores in the next two years.
Zero debt, Large Cash Reserves and Latest Performance
I love companies with low debt. But having zero debt and managing almost 1600 crores in cash reserves? Now that is something made of dreams! NESCO has been a very financially responsible company from its inception and the company has been without any debt for years. In addition, they transfer a good portion of their net profits to their cash reserves (after paying the dividends, which has been very consistent) so that any business expansion can be financed internally and not with external borrowings.
Let us take a look at the performance of the company for FY2023:
(Source: NESCO Annual Report FY2023)
As you can see from the above, there is a clear drop in revenues and profits during the COVID-hit FY2021. But the numbers have been solid since then on a nice, gradual upward trajectory. I like to see a slow but consistent growth in numbers instead of haphazard volatility, and these graphs above are almost cathartic for me to see.
Being a real estate company primarily, being debt-free takes on an even better form because we know that even during a slowdown (which affects real estate the most), the company will thrive without having to resort to loans or worse go bankrupt. So, this also makes NESCO a great business in my opinion.
Future Outlook
The NESCO IT Park has a 90% occupancy rate with marquee clients such as BlackRock (world’s largest investment fund with AUM of $8.5trillion), HSBC, pWC, KPMG, WeWork and MSCI (Morgan Stanley Capital Index – a company that provides indexing services to financial markets worldwide) with two major towers. This occupancy rate is set to continue and the rental income from the same is set to increase in the future – especially with BlackRock forming a JV with Jio Financial Services and expanding further in India. The revenue from real estate has been increasing at a CAGR of 11%.
But the outliers in the business were NESCO Foods which saw a 225% increase in revenue from last year and Bombay Exhibition Centre (BEC) which saw a whopping 825% increase in revenue.
NESCO Ltd is a well-capitalized small cap company with zero debt and a very healthy cash position to help it expand its business for the future, riding on the commercial real estate boom that would be coming in this decade in India. It would be prudent for the intelligent investor to take a close look at this company as it can be a good addition to your stock portfolio for the future.
Disclaimer: The content of the above article is for information purposes only. Please consult your certified financial advisor before making any investments.
One of the biggest IT distributors in India with access to major global markets, maybe poised for its next phase of growth.
Introduction
Founded in 1993, Redington India Ltd has emerged as a leading supply chain solutions provider in the technology and telecom sectors. With its headquarters in Chennai, India, the company has established itself as a prominent player in the distribution and services space. Redington’s core focus lies in distributing an extensive range of IT products, mobile devices, and consumer electronics to a diverse network of resellers, retailers, and corporate clients across India and other countries.
It is currently an $8.4 billion technology solutions provider with more than 290 international brands in its distribution network in more than 38 markets.
In this brief research report, we will focus on Redington’s fundamentals, SWOT analysis, recent performance and the possible reason for a fall in stock price (which gives us a great buying opportunity).
Fundamentals
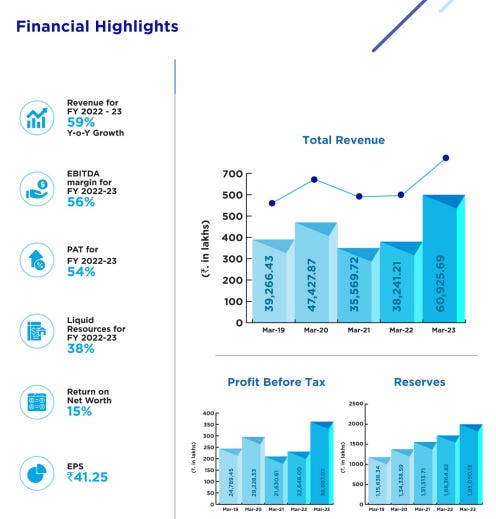
The company has impressive financials, with a very attractive PE ratio of 8.65 and a PB ratio of 1.61. This means that the company is valued very close to its actual book value and the earnings are very much in line with its stock price. In addition, Redington has been a consistently dividend-paying company throughout its history, with a latest yield of 4.8%. The latest dividend payment was on 7 Jul 2023 with INR 7.2/- paid for every share. Redington also has a very attractive debt profile with net debt to equity at a heathy ratio of 0.6.
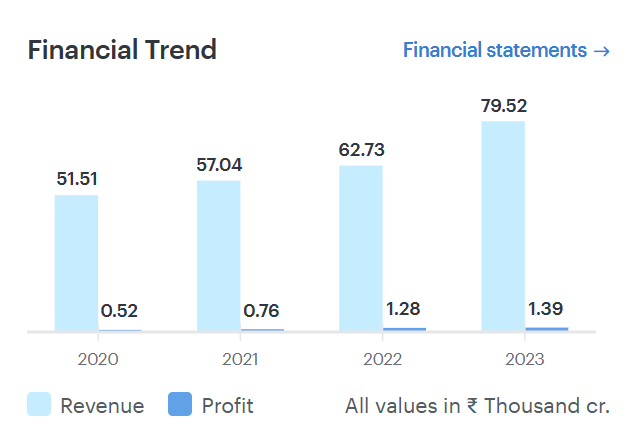
Financial Trend of Redington (courtesy Zerodha/Ticker Tape)
If you have listened to my podcasts, and my Udemy course then you will know that I really love companies with low debt, and in fact most of the companies in my Indian portfolio are either zero-debt or low debt companies.
Let us look at the shareholding pattern of Redington now. There is some very interesting data there:
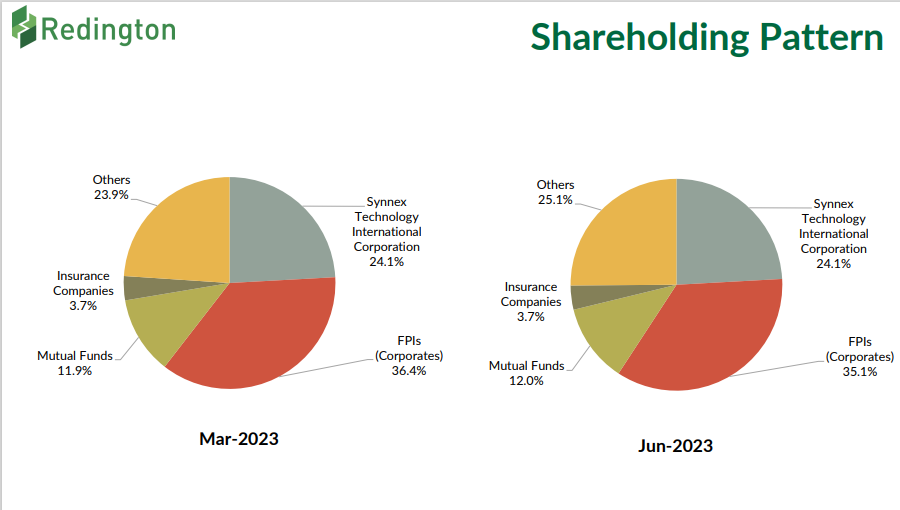
Redington Shareholding Pattern
The company has no promoters. That’s right, it is owned by various shareholders with foreign ownership at a whopping 59%! The Synnex Technology Corporation (NYSE: SNX) is an American company that is also an IT distributor in the US and the rest of the world. I have observed that any company having a significant ownership from FIIs and FPIs are always much better in quality. Another such a stock is SHRIRAM FINANCE (which we will talk about in detail, stay tuned). So, this also reinforces the excellent fundamentals that Redington has and makes it a good stock to invest in.
Since listing the company has created enormous wealth for its shareholders with almost 800% growth in stock price. The company has also maintained a high rate of profitability which has started accelerating in the past 5 years. The ROE of the stock over the past 10 years has been an impressive 18% and ROCE at 26%. These are great fundamental returns for a stock with the market cap of Redington and this means that the growth and expansion stage has just started.
Strengths
Current Market Position
Redington has a strong market position in the IT products distribution within India along with Ingram Micro Pvt Ltd (another major player in this industry) garnering the major share of the market in domestic IT distribution. The company is also the market leader in the Middle East and Africa (MEA) markets through its step-down subsidiary, Redington Gulf FZE, while its step-down subsidiary, Arena Bilgisayar Sanayi ve Ticaret A.S. (Arena), is one of the largest players in Turkey. It has strong relationships with leading vendors such as HP, Dell, Samsung, Lenovo, Cisco, and Microsoft in the IT products business, and has over time consolidated its position as a leading distributor for these vendors.
Revenue Streams and Diversification
REDIL’s revenue stream is highly diversified in terms of the IT, mobility, and service business verticals, as well as geographically with REDIL present in 38 markets. The IT consumer segment handles the distribution of personal computers (PCs), laptops and other consumer lifestyle products, while the IT enterprise segment caters to networking, software, server storage, cloud services. In the mobility vertical, REDIL primarily focuses on smartphones. The company has gradually enhanced the proportion of mobility revenue in its overall revenue supported by the rapid penetration of smartphones in the domestic market as well as overseas market leading to share of mobility revenue increasing to 32% in fiscal 2023 compared to 27% in fiscal 2018.
Liquidity Position and Risk Management
Redington has been doing a great job at generating cash (which is one of the most attractive things about a company to invest in) and also maintaining a good risk management profile in its business. These two are very important in my opinion, because even the great Warren Buffett has said that some of the best companies he has invested in, have been amazing cash-generating businesses.
The company enjoys strong liquidity, with cash surpluses of about Rs. 1951 crore as on March 31, 2023, and bank lines of Rs.2800 crores which has been utilized on an average at 12% over the past 12 months ended April 2022. Now this means that, even though Redington had a credit line to the tune of Rs. 2800 crores, only 12% or Rs. 336 crores have been utilized by them. Imagine having a credit card with a limit of Rs. 2800 but using only Rs. 336 because you that’s all you need! This means they are using their credit lines very judiciously. Another green flag.
During fiscal 2023, Redington generated net cash accruals of over Rs.1000 crore (post adjustments for dividend outflow of Rs 515 crore). The company’s cash accruals are expected to remain healthy and is expected to be sufficient to meet capex and working capital requirements.
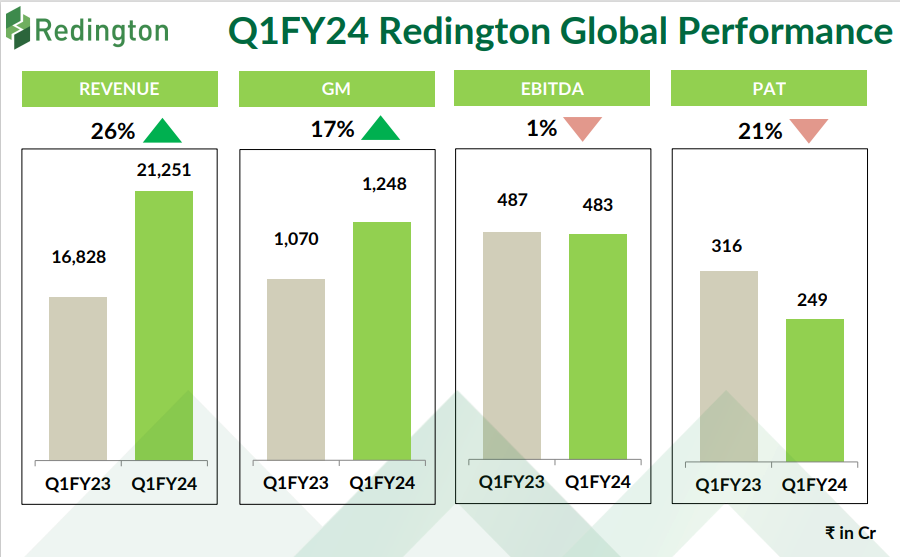
Most Recent Performance – Q1 2024
Redington has had a really good Q1 2024 performance, that is evident from their earnings results where the company reported a 26% higher revenue than the corresponding quarter in FY23. Also, this is the highest ever quarterly revenue in the history of the company at 21,250 crores. Let’s take a look at the numbers:
So, what is the reason behind its fall in stock price recently?
In addition to the existing market downturn that has been triggered due to the US interest rate scenarios, one of the major reasons has been the stepping down of its Managing Director Mr. Rajiv Srivastava for personal reasons. You see, the markets do not like it when stable companies’ top management resigns for unclear reasons. This is one of the triggers for a sell for most investors as there could be impending issues that are flagged by such a resignation.
Most top management officials either “retire” or move on to better opportunities and announce the same publicly, so as to not create panic in the markets or minds of investors. Mr. Srivastava has been with Redington since April 2021 in the capacity of Joint Managing Director and then was elevated to Managing Director in April 2022. Now, Mr. Srivastava has had a stellar career – he was formerly the MD and CEO of Indian Energy Exchange, and during his stint at IEX, he transformed the publicly listed company into a diversified business enterprise that significantly improved shareholder value. If you have been following us on Twitter or Instagram, then you would know that IEX is part of my Indian portfolio.
So, the departure of such an eminent professional at such short notice has definitely dented the confidence of the investors. From my point of view, this could be because of a genuine personal reason and does not pose any serious challenge to the performance of the company. Instead, this depression in stock price can be a valuable opportunity to buy.
So, there you have it – a quick brief on this amazing company and why I’m invested in it for the long term. With its strong fundamentals, this one is a pick for the future.
Disclaimer: The above article is for informational purposes only. The author has long positions in the stock mentioned above. Please consult your certified financial advisor before investing.
Optimizing Investment Portfolio Diversification for Better Returns
Your portfolio will continue to beat the market if you keep in mind these simple, important diversification rules.
Introduction
Investing is a powerful tool for building wealth, but it comes with its fair share of risks. One of the key strategies to manage these risks and potentially enhance returns is by optimizing investment portfolio diversification. In this blog post, we’ll delve into the concept of diversification, its benefits, and practical steps to create a well-diversified investment portfolio.
Understanding Diversification
Diversification is the practice of spreading your investments across different asset classes, industries, geographic regions, and types of securities. The rationale behind diversification lies in the principle of not putting all your eggs in one basket. By allocating your investments across various categories, you can reduce the impact of poor performance in any single asset on your overall portfolio.
Check out how I diversified my personal portfolio to get 21.3% CAGR on my returns here.
The Benefits of Diversification
1. Risk Reduction: Diversification minimizes the impact of market volatility on your portfolio. When one asset class underperforms, others may still provide positive returns, helping to offset losses.
2. Consistent Returns: Different asset classes have varying levels of sensitivity to market changes. By holding a mix of assets that react differently to economic conditions, you can potentially achieve more stable and consistent returns over time.
3. Potential for Higher Returns: While diversification doesn’t eliminate risk, it can help you strike a balance between risk and reward. A well-diversified portfolio may allow you to capture growth opportunities in various sectors while managing potential downsides.
Steps to Optimize Portfolio Diversification
1. Define Your Investment Goals: Before diversifying your portfolio, clarify your financial goals, risk tolerance, and investment horizon. Your objectives will guide the level of diversification that’s appropriate for you.
2. Asset Allocation: Determine the allocation of your investments among different asset classes, such as stocks, bonds, real estate, and commodities. The right allocation depends on your risk appetite and time horizon.
3. Broaden Your Horizons: Look beyond domestic markets and consider international investments. Different economies and regions may perform differently under various conditions, offering additional diversification benefits.
4. Choose Different Sectors: Within each asset class, select investments from various sectors. For example, in the stock market, consider industries like technology, healthcare, finance, and consumer goods.
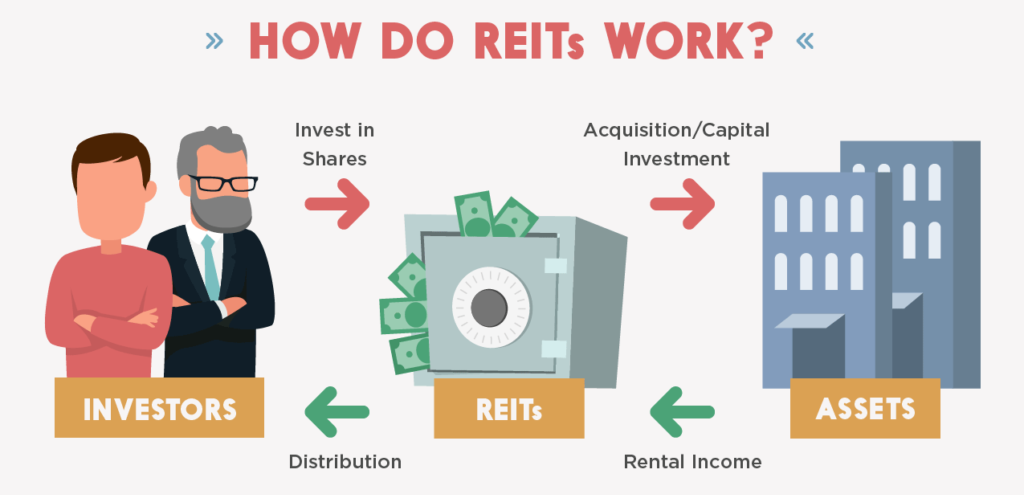
5. Explore Various Investment Vehicles: Don’t limit yourself to just stocks and bonds. Explore exchange-traded funds (ETFs), mutual funds, real estate investment trusts (REITs), and other investment vehicles that offer exposure to different assets.
6. Regularly Rebalance: Over time, the performance of different assets will cause your portfolio to deviate from its original allocation. Periodically rebalance your portfolio by selling overperforming assets and investing in underperforming ones to maintain your desired diversification.
Monitoring and Fine-Tuning
It’s important to note that diversification is not a one-time task. Regularly review your portfolio’s performance and reassess your investment goals. As your financial situation and market conditions change, your diversification strategy may need adjustments to ensure it remains aligned with your objectives.
And to summarize, optimizing investment portfolio diversification is a fundamental step towards managing risk and potentially enhancing returns. By spreading your investments across different assets and sectors, you can create a more resilient portfolio that can weather market fluctuations while seeking growth opportunities. Remember that while diversification can’t eliminate all risks, it’s a strategy that can help you achieve a more balanced and rewarding investment journey.
BRICS Currency: An Alternative to the Mighty Dollar?
BRICS nations are planning to formulate a new global reserve currency to replace the dollar.
Introduction
The global financial landscape has been dominated by the United States Dollar (USD) for decades, serving as the world’s primary reserve currency and a benchmark for international trade and finance. However, the emergence of the BRICS (Brazil, Russia, India, China, and South Africa) economies as significant players on the global stage has prompted discussions about the possibility of these nations launching their own common currency. This essay aims to explore the potential impact of such an event on the USD and the broader global financial system.
The Signing of the Bretton-Woods Agreement led to the global reserve currency status of the US Dollar.
Historical Context: The Dominance of the USD
The USD’s supremacy as the world’s primary reserve currency traces back to the Bretton Woods Agreement of 1944. Under this system, currencies were pegged to the USD, and the USD itself was backed by gold. Though the gold standard eventually collapsed in 1971 after the historic 15 Aug speech by Richard Nixon, the USD retained its preeminent status due to the size and stability of the US economy, as well as the trust engendered by the institutions that underpin the currency.
In addition, the global oil market, which was generally dictated by the geopolitical considerations put forth by the United States, adopted the US Dollar as the currency of choice for trade. As oil became the most valuable and largest-traded commodity in the world, the status of the US Dollar rose along with it, further reinforcing its status as the primary currency of choice by the rest of the world.
The Petrodollar keeps the US economy afloat.
The Birth of BRICS and Its Implications
BRICS is a grouping of five emerging economies that, collectively, represent a significant portion of the world’s population, land area, and economic output. These nations have grown both economically and politically, leading to discussions about the possibility of launching their own currency as a challenge to the USD’s dominance. Such a move could stem from a desire to reduce dependency on the USD and increase their influence in global financial affairs.
BRICS countries represent around 40% of the world’s population and a large proportion of resources.
Potential Advantages of a BRICS Currency
The BRICS countries are currently working on formulating a currency equivalent that resembles Special Drawing Rights (SDRs) of the International Monetary Fund (IMF), which is essentially a basket of currencies with a specific value that can be used for transactions across countries. It has been called the R5, which stands for the five currencies of BRICS – Ruble, Renminbi, Rupee, Real and the Rand.
There could be a crucial announcement regarding this during the BRICS summit that is slated for later this month, even though most of the foreign ministers of the alliance, especially Dr. S Jaishankar of India, have been downplaying the formulation of the currency.
1. Economic Sovereignty: A common BRICS currency could empower member nations with more control over their economic policies and trade relations. This could lead to reduced susceptibility to external economic shocks and the whims of global financial markets.
2. Trade Facilitation: A BRICS currency might streamline trade among member nations, eliminating currency conversion costs and exchange rate uncertainties. This could foster increased intra-BRICS trade and cooperation.
3. Geopolitical Influence: Launching a new currency could boost the collective geopolitical influence of BRICS nations, allowing them to exert greater influence in global financial institutions and negotiations.
Challenges and Considerations
1. Economic Divergence: One of the primary challenges for BRICS in launching a common currency is the considerable economic diversity among its member nations. Varying inflation rates, growth trajectories, and fiscal policies could complicate the formulation of a coherent monetary policy.
2. Trust and Credibility: Building trust and credibility for a new currency would be a significant hurdle. Investors and international markets have long regarded the USD as a stable and secure reserve. Convincing the global community of the stability of a BRICS currency would be an intricate task. In addition, there is a trust deficit between countries in the grouping too – like India and China. Having fought a major war in 1962, and further skirmishes as recent as 2022, it is difficult to imagine India giving way to a stronger weightage to Renminbi of China, which is already being used as reserve currency in many countries and even SDR baskets.
3. Potential for Fragmentation: Launching a new currency could also raise questions about the unity of the BRICS bloc. Disagreements over monetary policy, exchange rates, and economic priorities could strain the cooperation required to sustain a common currency.
Impact on the USD
The launch of a BRICS currency would likely have profound implications for the USD and the global financial system as a whole.
The Federal Reserve, US Central Bank, will have to bring in extensive reforms and frugal policies to rein in a major blow to the US Dollar if BRICS decides to launch their own reserve currency.
1. Reserve Currency Status: The most immediate impact would be on the USD’s reserve currency status. If the BRICS currency gained traction as a viable alternative, central banks around the world might diversify their reserves away from the USD, leading to a decline in its value and significance. This could lead to a catastrophic fall in the value of the US Dollar and USD-dominated instruments like Treasury Bonds and Oil futures. Such an event would lead to a severe depression not only in the US, but also the rest of the world. It could also impact trade transactions and other currencies.
2. Trade and Finance: The USD’s use as the primary currency for international trade and finance might diminish if BRICS nations opt to use their own currency for transactions among themselves. This could lead to a reduction in demand for USD and, consequently, a potential weakening of its value.
3. Interest Rates and Debt: The USA’s ability to borrow at lower interest rates, a privilege associated with the USD’s status, could be affected. As demand for USD decreases, borrowing costs might rise, impacting the US government’s ability to manage its debt.
4. Geopolitical Implications: A significant shift away from the USD could impact the USA’s geopolitical influence. The use of the USD as a tool for sanctions and diplomacy might be curtailed, reshaping global power dynamics.
Responses and Adaptations
1. USD Devaluation Mitigation: To mitigate the devaluation of the USD, the USA could adopt prudent fiscal and monetary policies. Ensuring a strong and stable economy would help maintain investor confidence in the USD.
2. Reforming International Institutions: The launch of a BRICS currency might stimulate discussions about reforming international financial institutions like the International Monetary Fund (IMF) and the World Bank. These discussions could lead to more inclusive decision-making processes and the reevaluation of voting rights, reflecting the changing global economic landscape.
3. Enhanced Cooperation: Instead of solely perceiving the BRICS currency as a challenge, the USA could choose to engage in closer economic cooperation with BRICS nations. Collaborative efforts might lead to the development of new financial instruments and mechanisms that benefit all parties involved.
A secure global economy needs a reserve currency that cannot be manipulated by one player.
What Next?
The launch of a BRICS currency has the potential to significantly impact the USD and reshape the global financial landscape. While there are challenges and uncertainties surrounding such an endeavor, it is clear that the USD’s status as the world’s primary reserve currency is not guaranteed in perpetuity. The rise of the BRICS economies and their pursuit of economic and geopolitical influence could trigger a paradigm shift, forcing the international community to adapt and evolve in response to a changing world order. How nations navigate this complex terrain will play a pivotal role in determining the future trajectory of global finance.
The Hindenburg – Adani Quandary : What You Need to Know
A quick and simplified take on Hindenburg Research’s Big Short of Adani stocks
What’s Happening Exactly?
A US-based investment research firm – Hindenburg Research – recently published a scathing research report on Adani Group of companies, accusing the top management of corporate fraud and stock manipulation. The report mentions the findings of a 2-year investigation that throws light into Adani Group’s accounting management practices and other irregularities.
Hindenburg says that it has taken a short position against Adani stocks as its findings has led them to believe that a collapse in stock prices is likely in the near future. The firm’s modus operandi has remained the same for many other companies which it has short-sold before. Their track record can be seen here.
Adani Group has vowed to respond with a point-by-point rebuttal of the same, including threats to sue Hindenburg in the US jurisdiction. Details are still awaited on this as it’s a developing story.
Let’s take a brief look into the controversy, and break it up into four major points:
What are the allegations and why have they published the report now?
How has the firm engineered their short position in Adani stocks?
How have they benefitted from the panic that has set in among investors?
How will this affect the markets?
Who is Hindenburg Research?
Before we understand who they are, here’s some history on their name.
LZ Hindenburg was an airship that was constructed in Germany that went down in a terrible accident in 1937. Many of you might know this as the Hindenburg disaster. The airship itself was named after Field Marshal Paul von Hindenburg, who was the ruler of Germany from 1925 to 1934. The airship went down in flames causing 35 fatalities while trying to land in New Jersey, USA after a transatlantic flight from Frankfurt. Germany.
Iconic picture of the Hindenburg disaster.
Hindenburg Research was inspired by this theme, and they are known to look for stocks of companies who they expect to go down spectacularly like the airship itself. That makes morbid sense in a way, I guess. The firm is based in the United States, founded by Nathan Anderson, and commenced operations in 2017. The firm operates under the concept of “activist short-selling” – an investment idea that stems from protecting the retail investors from fundamentally unsafe stocks, but also making a profit from a short position against the same companies.
A short position, for those not in the know, is merely the opposite of a long or buy position in a stock or investment asset. It is essentially a trade where you sell high and buy back low. This can be a complicated concept, but is in fact a very common activity in the stock markets. We shall discuss this in detail later in this post.
Allegations Against Adani Group and Timing of the Report
Let’s look at some of the allegations against Adani group companies that Hindenburg Research has put forth in their controversial report:
Stock Manipulation
Accounting Fraud
Unsustainable Debt Levels
Money Laundering
Siphoning Investor Funds through shell companies
Again, please go through the research report on their website to understand the entire gamut of allegations levelled by them. These are just a few major ones that have been picked to simplify the explanation of the issue in this article.
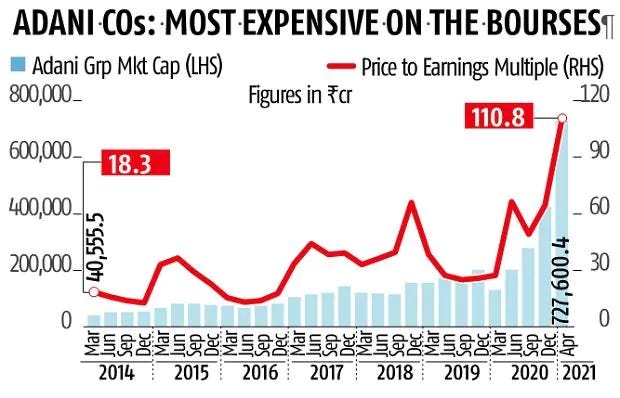
Out of all the above points, there is one point that has been common knowledge for a while now – the high leverage or debt levels taken on by Adani companies. In addition to this, the Price-to-Earnings (PE) ratios of most of the listed Adani companies are some of the highest in Indian markets. This is definitely not a good sign; but one must also keep in mind that most Adani companies have very high capital-intensive operations. This means a lot of their capital will have to come from debt or pledging of their own shares which have shot up in value in the last 2-3 years.
Adani Group valuation over the years.
Either way, an investor needs to understand that highly leveraged companies often face difficulties in a market downturn; smaller companies even go bankrupt. While nothing of that sort has happened to Adani companies, it doesn’t take much for the worst to happen. Even big companies like Enron – which was once the most valuable company of America – have collapsed like a house of cards.
Now let’s look at the timing of the report. You will find something very interesting here.
Adani Enterprises, one of the biggest company in the Adani Group, is about to go for a Follow-on Public Offer or FPO, in the near future. An FPO is simply a second part to an IPO or Initial Public Offering. It is when a company listed on a stock exchange issue new shares to existing shareholders and new investors. An FPO is not that common in most developed stock markets. There are three major reasons why a company goes for an FPO:
To expand the shareholder base
To reduce the debt of the company
To raise additional capital for the company
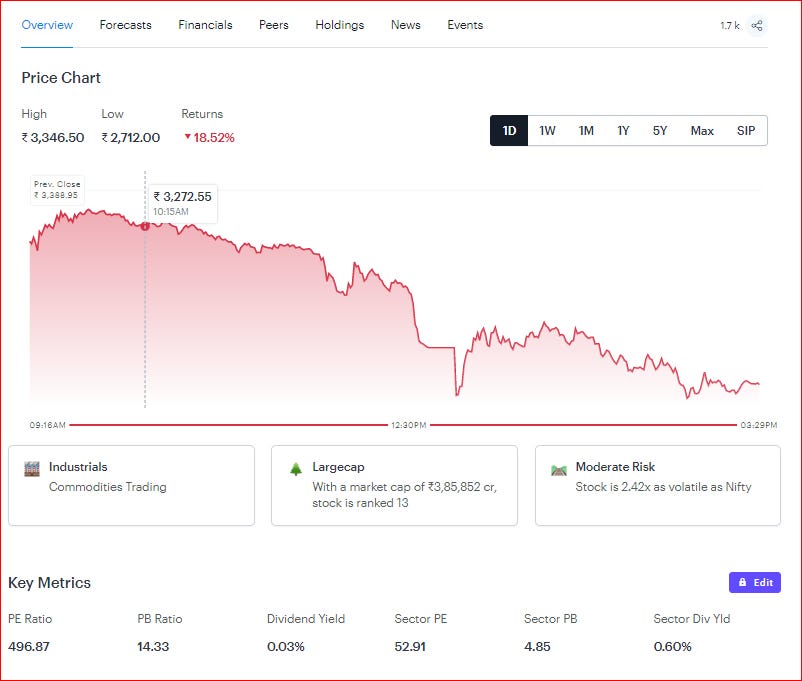
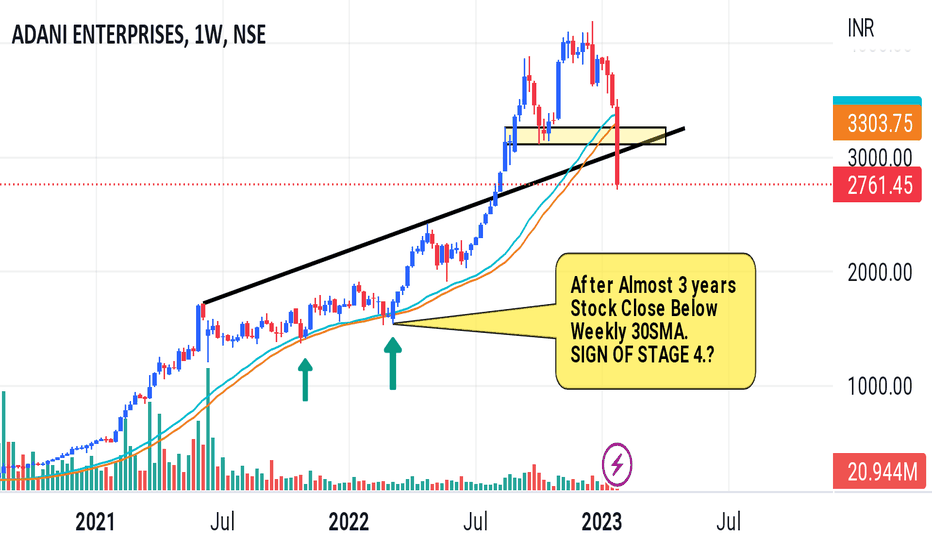
As you can see, Adani Enterprises is in dire need of new capital and lowering its debt structure. It is also trading at almost 400x PE multiple (as on 29 Jan 2023) and 10x PB ratio. Even if you compare its peers in the same industry, these are alarming numbers.
Adani Enterprises snapshot (Courtesy: TickerTape)
However, there is a catch.
The FPO price of Adani Enterprises is at a premium to its current market price (CMP). What does this mean? It means that even though the CMP in the secondary market (as on 29 Jan 2023) is INR 2761/-, the FPO price is set at INR 3200/-! Why would it make sense for a new investor to subscribe to the FPO when he/she can get the same stock at a lower price in the secondary market?
Exactly. It makes no sense.
And this has reflected in the poor subscription numbers for the Adani Enterprise FPO – only about 2% of the retail portion of the FPO has been subscribed to at the time of writing. However, this has an even more important connotation to Hindenburg Research. Let’s find out why.
If the FPO becomes successful, it essentially means that Adani Enterprises stock prices will rally from its CMP (2761/-) and converge with the FPO price (3200/-). It may even go higher from there depending on investor sentiment. What does this mean for a short seller in the same stock? The short seller will have to either square off his position at a huge loss (because the price has rallied instead of coming down as per his market view) or he will have to bring in more collateral as margin to sustain his short position.
This is a very bad situation to be in, and can even make the short seller go bankrupt in one fell swoop. If he had taken other investors’ money to take his short position then it will be even worse. And guess who has a big short position against Adani Enterprises at the moment?
You guessed it! Hindenburg Research.
Hence, it is in Hindenburg’s interests that the FPO doesn’t succeed. In addition, if the research report creates panic among investors of Adani stocks, their short position now gets into profit – thereby killing two birds with one stone.
That explains the timing of the research report and it makes perfect sense.
How have They Engineered their Big Short?
It is not easy for a foreign investor to short-sell a stock in the Indian markets. In fact, the stock exchanges regulator SEBI, has explicitly banned short selling of shares by Foreign Institutional Investors (FII). The same can be viewed on the link below:
Hindenburg Research does not have any subsidiaries in India. Hence, it would be illegal for them to short-sell Adani stocks in India (onshore). Therefore, it is likely that they have engineered their short in an offshore market (like Singapore or London). They themselves have disclosed that their short position has been achieved through US Bonds and non-India traded derivative instruments. This could mean that they have put up the US Bonds as collateral/margin and used an OTC derivative instrument (something that is not available to the regular public) to engineer this short.
Let’s see how it works.
You can short a stock in the cash market (regular stock exchange) or the derivatives market (Futures & Options). When you short a stock (say Adani Enterprises), you essentially “borrow” that stock from someone – usually your broker – and then sell it in the open market. Let’s assume you short sold the stock at 2700/-. Now with all the negative commotion going on, let’s assume the price crashes to 2200/-. At this time, you “buy back” the same stock from the open market at 2200/-, and return it to the broker (from whom you borrowed it for 2700/-). You get to keep the difference, that is 500/-.
Cool, huh?
Maybe, but it’s not as easy as it sounds.
When you borrow a stock, you have to post collateral with the broker – to cover the risk of the stock price going UP instead of DOWN. This collateral is called Margin. If your view was wrong about Adani Enterprises, and it’s price went from 2700/- to 3000/-, you are in a loss of 300/-. If it goes higher, the loss also accumulates higher and results in a “margin call” – a literal phone call from your broker to bring in more margins. This is a risk that is non-liquidating unless you “square off” your position or deliver the loss in more Adani Enterprises stock back to the broker.
It is a very risky trade. And this is why short-selling is not encouraged in most markets. It increases the chances of default and can even lead to a market collapse if the positions are too big.
A great movie recommendation for stock market enthusiasts.
It gets even more complicated in the derivatives segment, but you get to take more leverage with them. Thus, you can take a position that is much higher than what you can afford, but your losses also compound accordingly. To sum up, derivative shorting can make you go bankrupt overnight.
And Hindenburg has taken such a position using derivatives. As this would be a bespoke Over-The-Counter (OTC) instrument, the opportunity cost would also be consequentially high, due to the unavailability of any other standard instrument for them to short the market. Anyone remember Credit Default Swaps that Michael Burry created with Goldman Sachs for him to short the housing market in the movie The Big Short?
Michael Burry closes the deal with Goldman Sachs to create a bespoke instrument for him to short the housing market – The Big Short (2015)
Since they have been investigating Adani Group for the past two years, my bet is that they have initiated the short sometime in 2022, once they had all the data they needed. But Adani stocks have not seen any meaningful drop in prices in the last one year; in fact, they have been on the upswing. This means that Hindenburg might already be forced to put up more and more collateral/margin to sustain their short.
A successful FPO of Adani Enterprises might push them over the edge, and even make them go bust.
The Report Goes Live and Panic Spreads
On 24 Jan 2023, Hindenburg Research published their report with 88 questions for Mr. Gautam Adani, the Chairman of the Adani Group. It took a while for the report to get the attention they wanted. By 25 Jan, the panic had started to set in, and Twitter was alive with discussions on the same. Major news channels picked up on it and commenced extensive coverage. But since the next day was a market holiday on account of Republic Day, Adani stocks did not experience a price shock, but had started on a downtrend.
On 27 Jan, the lid fell off.
On Friday, Adani Transmission, Adani Green Energy, and Adani Total Gas closed at 20% lower circuits each. While Adani Power and Adani Wilmar hit 5% lower circuits each. Adani Ports wasn’t performing any better and tumbled by over 16% at the end of the day. Meanwhile, Adani’s flagship company, Adani Enterprises, which launched its FPO on Friday, nosedived by around 20% before closing at ₹2,762.15.
The Adani Group has lost $48 billion in value since the Hindenburg Research report was published and the net worth of Mr. Gautam Adani has come down by almost $21 billion, making him the 7th richest in the world from his earlier ranking of 3rd. This is probably one of the largest wealth erosions in history in such a short time, probably behind Amazon’s and Jeff Bezos’ fall in 2022.
It is beyond any doubt that the biggest beneficiary of this price action will be Hindenburg Research, breezing away to a windfall profit (pun not intended) on their short position. Even if not in profit, this will help them to free up the extra margins and use that capital for another opportunity.
Who Lost?
Whenever something of this kind happens in any market, or economy, there is usually one entity that always stands to lose.
The common man.
As of Tuesday, one of the biggest investors of Adani Group was the Life Insurance Corporation of India (LIC). They had an exposure of more than INR 75,000 crores ($9.5 billion) to Adani group companies. This is almost a 37% stake in the Adani Group! In addition to this, mutual funds – especially Index Funds – had another INR 25,000 crores ($3.2 billion) or so, making the total investment from the common man at around INR 1 lakh crores.
LIC lost nearly INR 19,000 crores in just the past week after the Hindenburg Research report came out. This is a massive 27% loss in two days! I am sure the mutual funds have also lost a similar percentage of their money in Adani stocks. If the fall continues, it can impact the whole Indian market disastrously. In addition to these DIIs, several retail investors also have direct exposure to Adani stocks – they will also feel the punch, as these scrips have given multibagger returns over the past three years.
After all, that is the nature of markets. And capitalism.
What Happens Next?
The fall in prices of Adani stocks are expected to continue if the market downturn of Friday (28 Jan 2023) was any indicator. It can even seem like a self-fulfilling prophecy, as the prices of the group companies go through a correction – bringing down the PE ratios to more rational levels. If the situation gets too extreme, the indices themselves – Nifty and Sensex – can see broad-based corrections. It is this kind of event, after all, that keeps the valuations of the indices in check.
Adani Group will vehemently oppose the allegations by Hindenburg and would probably publish a counter report to reinstate the faith of the institutions and numerous investors that have helped the meteoric rise of the group and Mr. Gautam Adani on the world stage. There could be investigations into the allegations by competent authorities, as this is the only way to establish the truth – Hindenburg has vested interests in the collapse of one of the largest business conglomerates of India anyway, so it would not be prudent to believe their report at face value.
As an investor, you must continue employing your successful strategies to pick the right stocks and leave out the noise. A correction in the market should always be looked at as an opportunity. For me personally, Adani stocks never passed my screeners of PE and Debt-to-Equity ratios so my exposure is nil. However, one should keep in mind that they are capital-intensive and maybe acceptable by a multitude of investors, LIC included.
Let us hope the truth comes out soon.
Happy investing!
(Disclaimer: The above article only interprets the market news on account of the Hindenburg report. The veracity of the report itself can only be verified by a competent authority like SEBI or the Government of India. The author does not condone the Hindenburg research report in any way nor has any investments in any companies of the Adani Group.)
The Indian Rupee has been in a free fall for the past two months. What started off as an incremental de-pricing has now evolved into frantic selling and investors moving back to the safe haven of the dollar.
But the Reserve Bank of India, has not been a mere spectator. It has swung into action as it always has, this time utilizing its massive war chest of more than $580 billion to stabilize the price of the Rupee. A weak currency result in a higher Current Account Deficit (CAD), fuels inflation and slows down international trade; so it’s only natural that RBI takes it upon itself to correct the situation on behalf of the Govt of India and the citizens.
Have you ever wondered how the RBI does this? Let’s break it down and simplify it.
RBI Action To Stabilize INR
We have already established RBI’s need to control the volatility in the value of the Rupee. USDINR is the most liquid currency pair for that, and most of RBI’s interventions are aimed at stabilizing this pair. As you might already be aware, the FX markets are highly volatile and extremely speculative. And this speculation is what actually creates short-term price shocks in our markets too. So, RBI’s main agenda is to reduce this speculation. Towards this, there are four major measures that RBI implements:
1. Limit borrowing by banks: Banks love to borrow from RBI due to competitive costs. After all, cheap credit is what fuel expansion in a growing economy. Some of the borrowed money (in dollars) is used by the banks to speculate on their own (!) in the forward and spot FX markets to create an arbitrage opportunity. Not only this, but too much borrowing also comes at a cost. Hence, RBI makes it difficult for banks to borrow by increasing costs and capping the amounts. This forces banks to look at the market for borrowing funds, which is more competitive, and in turn, discourages speculation from their side.
2. Increasing Interest Rates: Higher interest rates encourage foreign investors to bring in more investments into India. This is a no-brainer as interest rates in the US and Europe have been at their lowest for almost a decade. This measure encourages the FPIs to buy INR so as to invest in Indian securities and bonds, by selling their dollars. In turn, this creates a demand for INR and helps in increasing its value vis-a-vis the US Dollar.
3. Increasing the Cash Reserve Ratios (CRR): A higher CRR means that banks have to keep more spare cash with the RBI, thereby leaving them with less cash to speculate with. RBI has also tweaked its policy to ensure banks keep the higher CRR on a daily basis, instead of fortnightly. Remember that RBI allows exemptions on this for NRE deposits, so as to stimulate more foreign remittances from NRIs living abroad. This happens because the banks will now reach out to more NRIs and offer higher returns on their forex deposits.
4. Selling USD on NDF and Spot FX Markets: This is the most interesting short-term action that RBI executes to cushion the fall of the Rupee. USDINR is traded on two major types of markets: the spot market and the Non-Deliverable Futures (NDF) market. As the name suggests, the spot market is where FX pairs are traded for immediate delivery on an exchange, whereas NDF markets are mostly Over-The-Counter (OTC). NDF markets are used to trade illiquid currencies for speculation and also to hedge risks by large players. USDINR is one of the largest NDF markets in the world, with South Korean Won, Chinese Yuan and Brazilian Real also being some of the heavily traded FX pairs.
NDF markets are usually located offshore of the illiquid currency, with London being the largest trading location while considerable trading happens in New York, Singapore and Hong Kong. But interestingly, India has an onshore NDF market too in GIFT City, Gujarat with monthly volumes as high as $27 billion. It is important to note that the offshore NDF markets trade at a premium to the onshore markets, creating high arbitrage opportunities. Speculators with easy access to USD, thus, bet heavily against the INR. This is when RBI enters the market with its massive war chest of FX reserves – currently at more than $580 billion – by selling USD and neutralizing the arbitrage opportunity. This creates an artificial demand for the Rupee and hence increases its value against the USD, thus resulting in a temporary stabilization of the currency.
This cat-and-mouse game continues until RBI decides that a generally fair value has been reached for the time being. However, with other macroeconomic indicators triggering again – like Fed rate hikes which make FPIs leave Indian markets for the US or high oil prices – this price action continues at a later time frame.
How Long Can RBI Fight the Fire?
Of course, RBI cannot keep selling precious foreign exchange to defend the Rupee. India needs its forex to pay for its imports (mainly oil, which is denominated in the USD) and thus, needs to find a long-term solution to the problem.
There are three major actions that India needs to do if it has to ensure a stable and strong currency:
1. Reduce dependence on oil, or find ways to import it in Rupees 2. Increase the export base, thereby bringing its CAD under control 3. Improve macroeconomic indicators in the economy, thereby, luring FPIs to invest more in India
As we are seeing from the rapidly-changing geopolitical scenario, India might just pull off a deal with Russia to import oil in Rupees. With more than 70% of the import value coming from oil, this would mean a strong reversion in the USD/INR rate. India is also making progress in enhancing its manufacturing capabilities which would result in more exports and thus more foreign exchange. This helps lower the CAD, and in turn, raises the global rating for the country. A better rating means more investments from FIIs and FPIs, and more capital for domestic businesses, thereby bringing in a “positive vicious cycle” effect.
Until these happen, RBI will have to fight the fire in the best ways it can.